
In our March 2010 issue we discussed the increasing prevalence of volatility overlays in structured products. Investor participation in the growth/loss of the underlying investment decreases as volatility goes up and increases as volatility goes down. This results in a lower product costs as the issuer does not have to bear the cost of hedging when volatility is high, and therefore costly.
Comparing volatility overlays
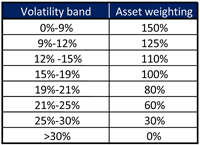 It should come as no surprise that not all volatility overlays are equal and investors should note both the targeted volatility of the investment, ie what does volatility need to average to obtain 100% participation, and the period of time that the volatility is averaged over, ie volatility averaged over a short period such as 20 days, or a long period, such as 6 months, can be counterproductive to the risk management process.
We consider 60 days to be a reasonable time frame to track rises and falls in volatility and typically use this as our yard-stick when comparing products. Investors looking for a reference point on volatility of the ASX 200 should expect this to typically sit in the range of 15%-20%.
Comment: